
Impact investing KPIs are the measures that show whether an investment is creating the intended environmental or social result. For water investors, the hard part is not finding more numbers. It is choosing a small set that connects a real water outcome to customer demand, operating performance and investor action.
A water-technology company may report litres treated, water reused, pollutants removed or sites monitored. Those figures matter, but they do not stand alone. An investor also needs to know who pays, whether the system operates reliably, how the result is verified and what could weaken the outcome over time.
The impact investing case for water therefore needs two linked scoreboards. One tracks commercial progress. The other tracks impact performance and risk. This guide sets out a practical framework for family offices, high-net-worth investors, private-equity teams and advisers assessing direct water opportunities.
What impact investing KPIs should tell you
A key performance indicator, or KPI, is a defined measure used to track progress against an important objective. A useful KPI has a clear unit, boundary, time period, owner and calculation method. It also has a reason for being in the investment case.
For a water company, “water impact” is too broad to be a KPI. The underlying question might be whether a treatment process helps a factory reuse water, whether a monitoring system detects quality changes sooner or whether a service reduces untreated discharge. Each question needs a different measure.
The Impact Principles describe an end-to-end approach that integrates impact through the investment lifecycle. Their framework includes strategic intent, assessment, negative-impact management, monitoring, learning and consideration of impact at exit. That is a useful test for any water KPI set. It should support decisions before investment, during ownership and when the asset is sold.
KPIs should answer five practical questions:
- What outcome is the company trying to create?
- Who experiences the outcome, and in what setting?
- How much change occurs, and for how long?
- What did the company and investor contribute?
- What negative effects or data weaknesses could change the conclusion?
A metric without those questions can become a marketing statistic. A metric connected to them can become part of investment governance.
Start with the water problem and investment thesis
Begin with the paying-customer problem, not the dashboard. A water company may serve an industrial site, utility, property owner, agricultural operator or public authority. The customer’s problem shapes the relevant outcome and the commercial route to revenue.
For example, an industrial reuse company may need to prove stable water quality, reliable availability and cost-effective operation. A monitoring company may need to prove detection quality, customer retention and the value of earlier intervention. A resource-recovery company may need to connect recovered material, treatment performance and the customer’s avoided cost.
Write the investment thesis as a chain:
- A defined customer has a costly or regulated water problem.
- The company provides a product or service that addresses part of that problem.
- The customer pays through a clear contract, project, licence or service model.
- The operation produces a measurable water or environmental outcome.
- The company can repeat the model without losing quality or margin.
Each link should have at least one measure. This prevents an impact claim from floating above the business model. It also helps an investment committee see where a weak KPI could become a commercial risk.
Use a baseline before setting a target. The baseline might describe water use, discharge quality, service reliability, customer operating cost or the current monitoring process. Without a baseline, a later improvement may be impossible to attribute or compare.
Use a five-layer KPI stack
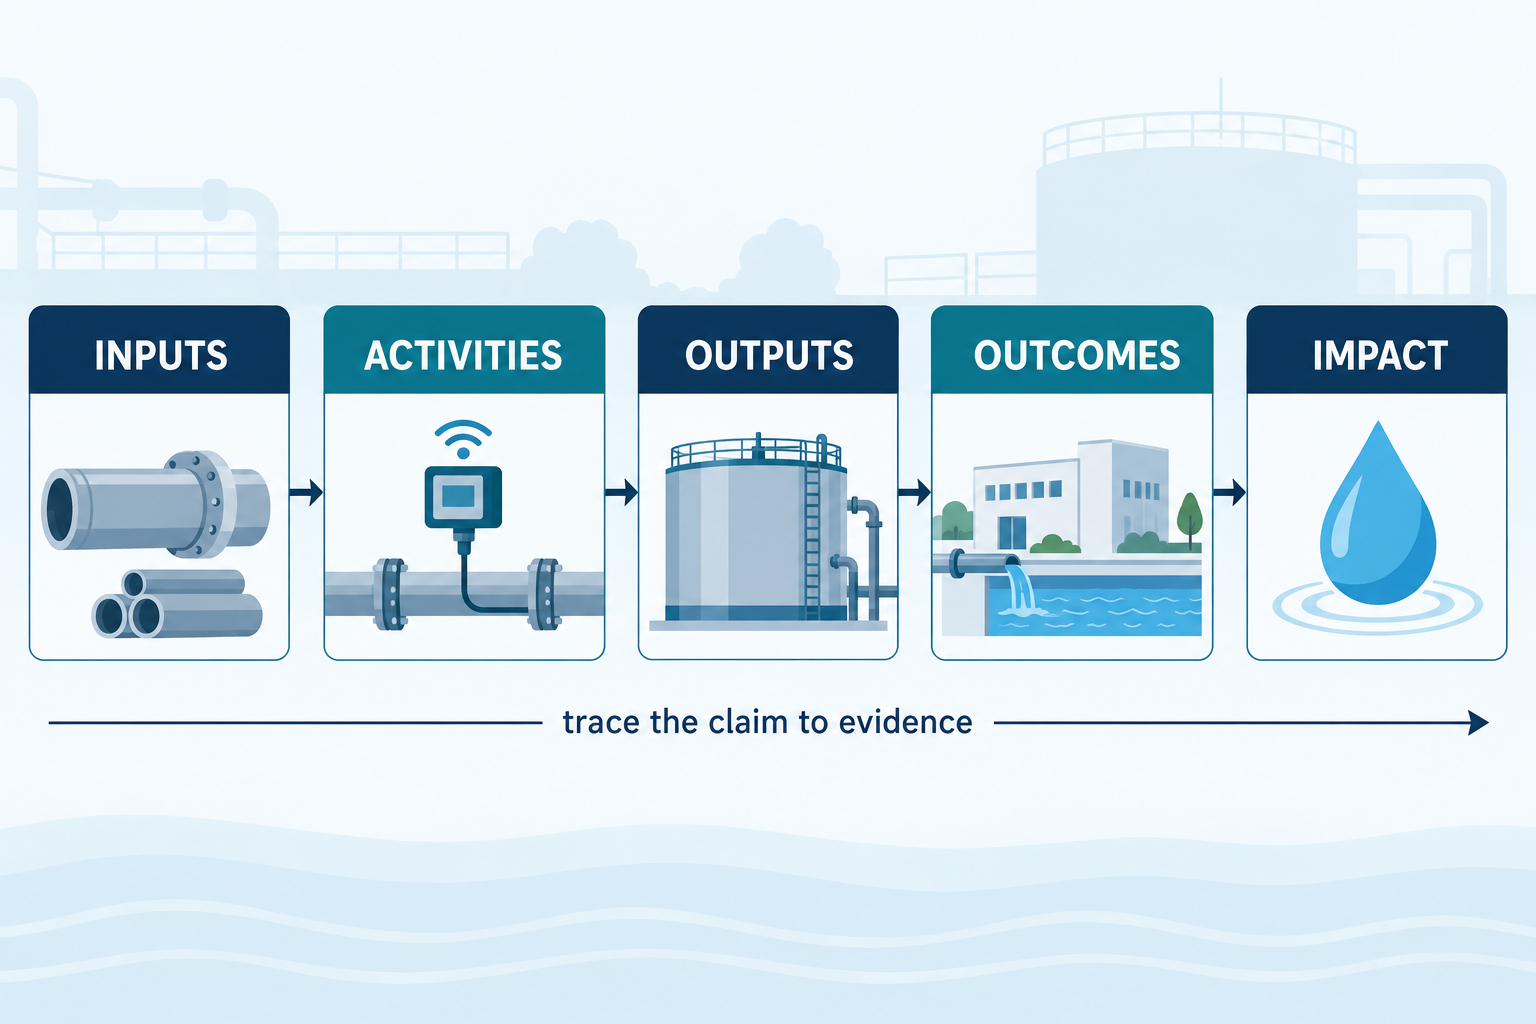
Investors can organise the KPI set into five layers. The layers are not a universal standard. They are a practical way to keep inputs, activity, outputs, outcomes and impact distinct.
1. Inputs
Inputs are the resources used to deliver the solution. They may include installed capacity, staff time, monitoring equipment, energy, treatment chemicals, data systems or capital expenditure. Inputs show what is available, not what has been achieved.
2. Activities
Activities describe what the company does. Examples include treating a process stream, monitoring a network, maintaining equipment, testing a sample or upgrading a customer site. An activity KPI can show delivery discipline, but it should not be presented as an impact outcome.
3. Outputs
Outputs are the immediate products of the activity. Examples include cubic metres processed, sites connected, samples analysed or treatment units commissioned. Output measures are often easier to collect than outcomes. That makes them useful, but also easy to overstate.
4. Outcomes
Outcomes describe the change experienced by a customer, community, ecosystem or other stakeholder. In water, this might involve safer water quality, more reliable supply, reduced water intensity or improved compliance with an agreed standard. The outcome must be defined in context.
5. Impact
Impact is the important positive or negative change that the investment helps create. It is the layer most exposed to attribution problems. A company may contribute to an outcome without causing all of it. That distinction should be clear in the KPI design.
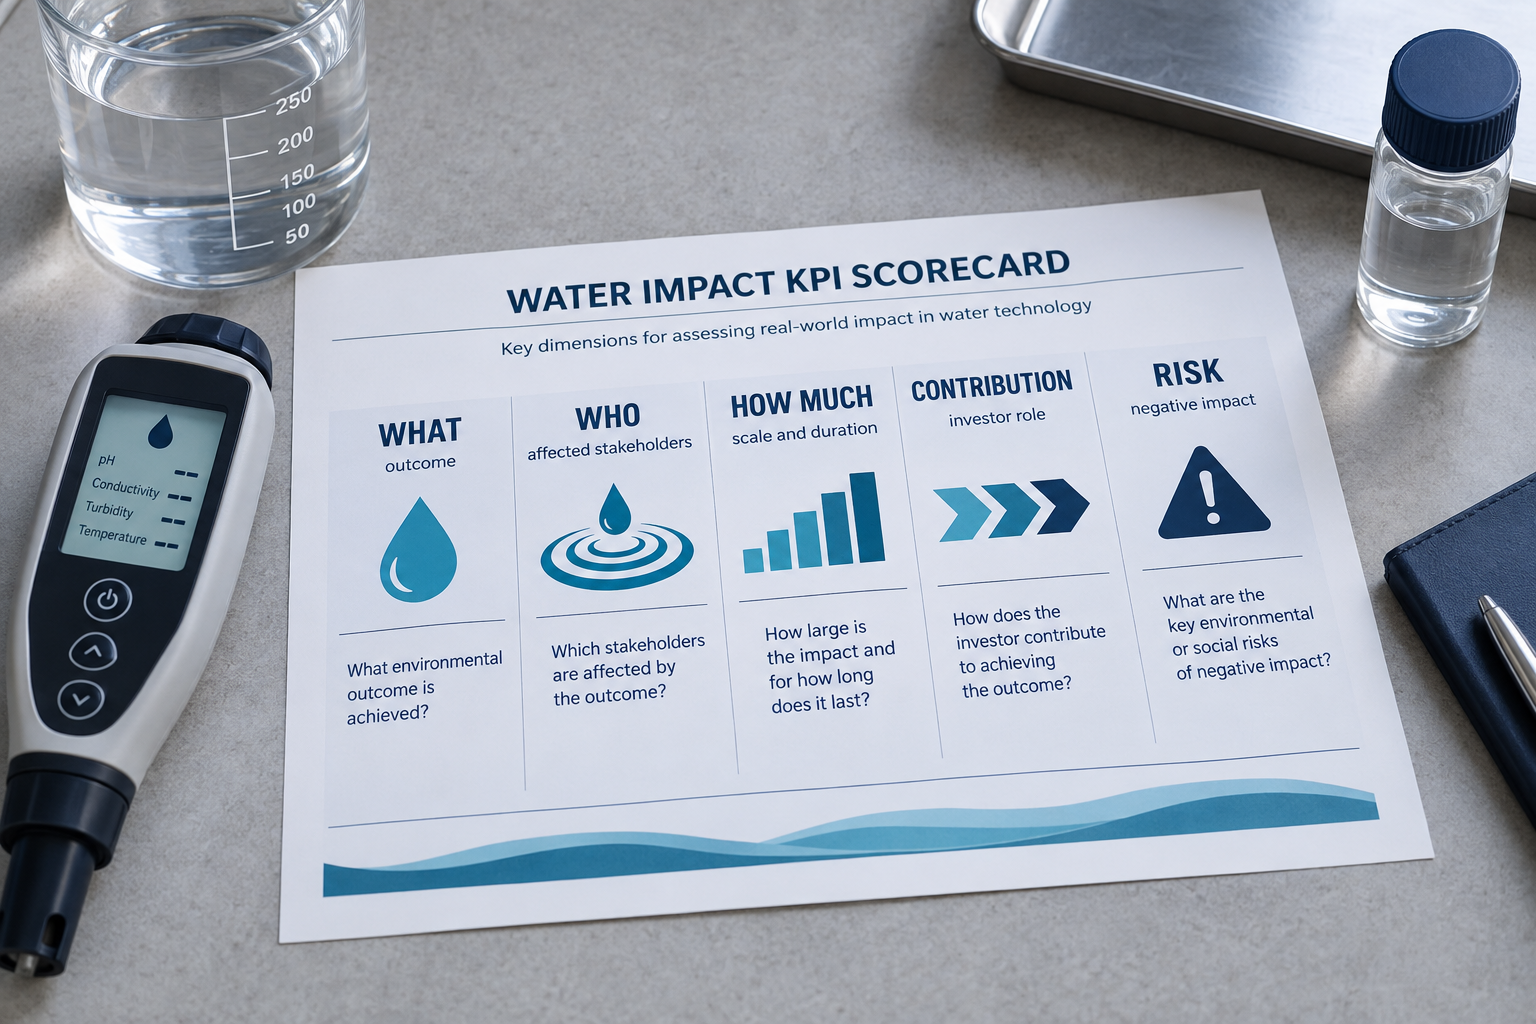
IRIS+ describes impact measurement through dimensions that include what happens, who experiences it, how much occurs, the investor’s contribution and the risk of negative impact. Its metric catalogue offers qualitative and quantitative measures. Investors can use such frameworks as a starting point, then adapt them to the water company and its context.
Match metrics to the water business model
The right KPI set depends on how the company creates value. A water investor should expect some common measures across a portfolio, but should not force identical indicators onto businesses with different technologies and customers.
| Business model | Commercial measures | Impact measures | Risk checks |
|---|---|---|---|
| Water reuse or treatment service | Contracted sites, recurring revenue, uptime and gross margin | Water treated or reused, quality result and avoided freshwater demand | Energy intensity, concentrate or sludge route and permit conditions |
| Monitoring and analytics | Sites connected, retention, recurring revenue and response time | Relevant parameters monitored, detection performance and intervention time | Calibration, sampling bias, false alerts and data security |
| Resource recovery | Recovered-product revenue, yield, customer cost and payback period | Material recovered, avoided disposal and water-quality improvement | Contaminant transfer, end-market demand and process reliability |
| Water infrastructure or equipment | Orders, backlog, installation time and service cost | Capacity enabled, loss reduction or service availability | Embodied impacts, maintenance needs and customer concentration |
The table is a prompt for diligence, not a template for invented targets. The final measure should reflect the company’s product, customer contract and operating boundary. A sensor business should not claim treated water merely because its data supports a treatment decision.
Connect impact metrics to commercial performance
Water impact and commercial performance should meet in the operating model. If an impact KPI never reaches customer value, revenue quality, cost or risk, the company may struggle to sustain the result.
Consider a treatment service. A rise in treated volume may be positive, but an investor should also ask whether the extra volume came from a paying contract, whether quality stayed within specification, how much energy was required and whether the gross margin improved or weakened.
For a monitoring platform, the impact case may depend on data being used. Sites connected is an output. The stronger chain may be reliable readings, timely alerts, action by the customer and a reduction in a defined water-quality or operational problem.
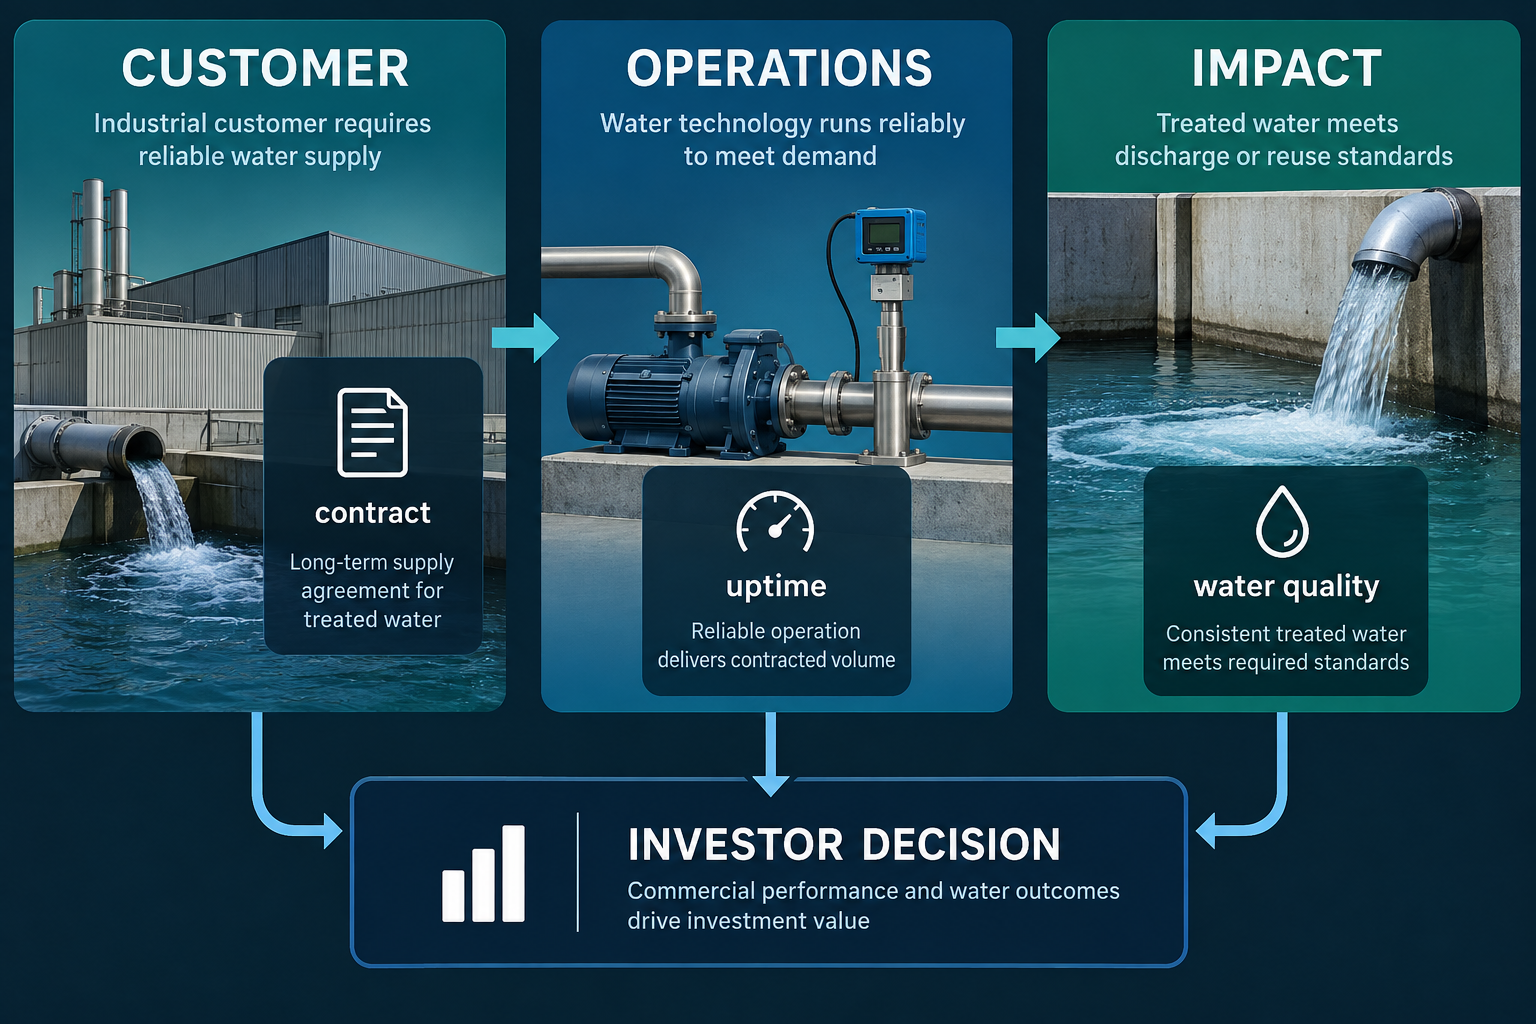
Useful commercial KPI areas include contracted recurring revenue, customer retention, gross margin by deployment, implementation time, service cost, downtime, working-capital needs and customer concentration. These are not impact measures. They show whether the company can keep delivering the activity that supports the outcome.
Useful impact KPI areas may include treated or reused water, water-use efficiency, pollutant load, quality compliance, service continuity, customer exposure to water stress and stakeholder outcomes. The metric should have a defined unit and a stated boundary.
The European Commission’s taxonomy materials show why regulatory language needs care. The EU Taxonomy includes criteria for activities that contribute substantially to the sustainable use and protection of water and marine resources, alongside other environmental objectives. Taxonomy alignment is not the same as impact proof, commercial validation or investment performance. It is one reference point that may inform the evidence map for relevant activities.
Test additionality and investor contribution
Additionality asks what changed because the company, financing or investor was involved. It is different from the existence of a useful product. A technology can produce a good outcome while an investor’s specific contribution remains limited or unproven.
Ask what would have happened without the investment. The counterfactual may be a delayed deployment, a smaller pilot, less customer access, weaker measurement or no change. The answer is often uncertain. That is acceptable if the uncertainty is recorded rather than hidden.
Contribution can take several forms:
- Providing growth capital for a proven deployment model.
- Supporting a pilot that converts technical evidence into a customer contract.
- Helping the company improve data collection, governance or reporting.
- Opening commercial relationships that accelerate adoption.
- Using ownership or lender rights to improve impact controls.
Do not turn those actions into a claim of sole causation. A contribution KPI could track agreed milestones, capital deployed to a defined use, customer introductions that progress to contracts, or improvements in the company’s impact-management system. The measure should show action and evidence, not just intention.
Impact should also be considered at exit. A buyer may have a different strategy, reporting standard or appetite for maintaining the water outcome. A responsible exit plan should identify which controls, contracts and data systems need to survive the ownership change.
Audit data quality before trusting the dashboard
A precise number can still be weak evidence. Water data may come from meters, laboratory samples, sensors, customer records, invoices, models or manual logs. Each source has its own boundary, frequency, calibration and error risk.
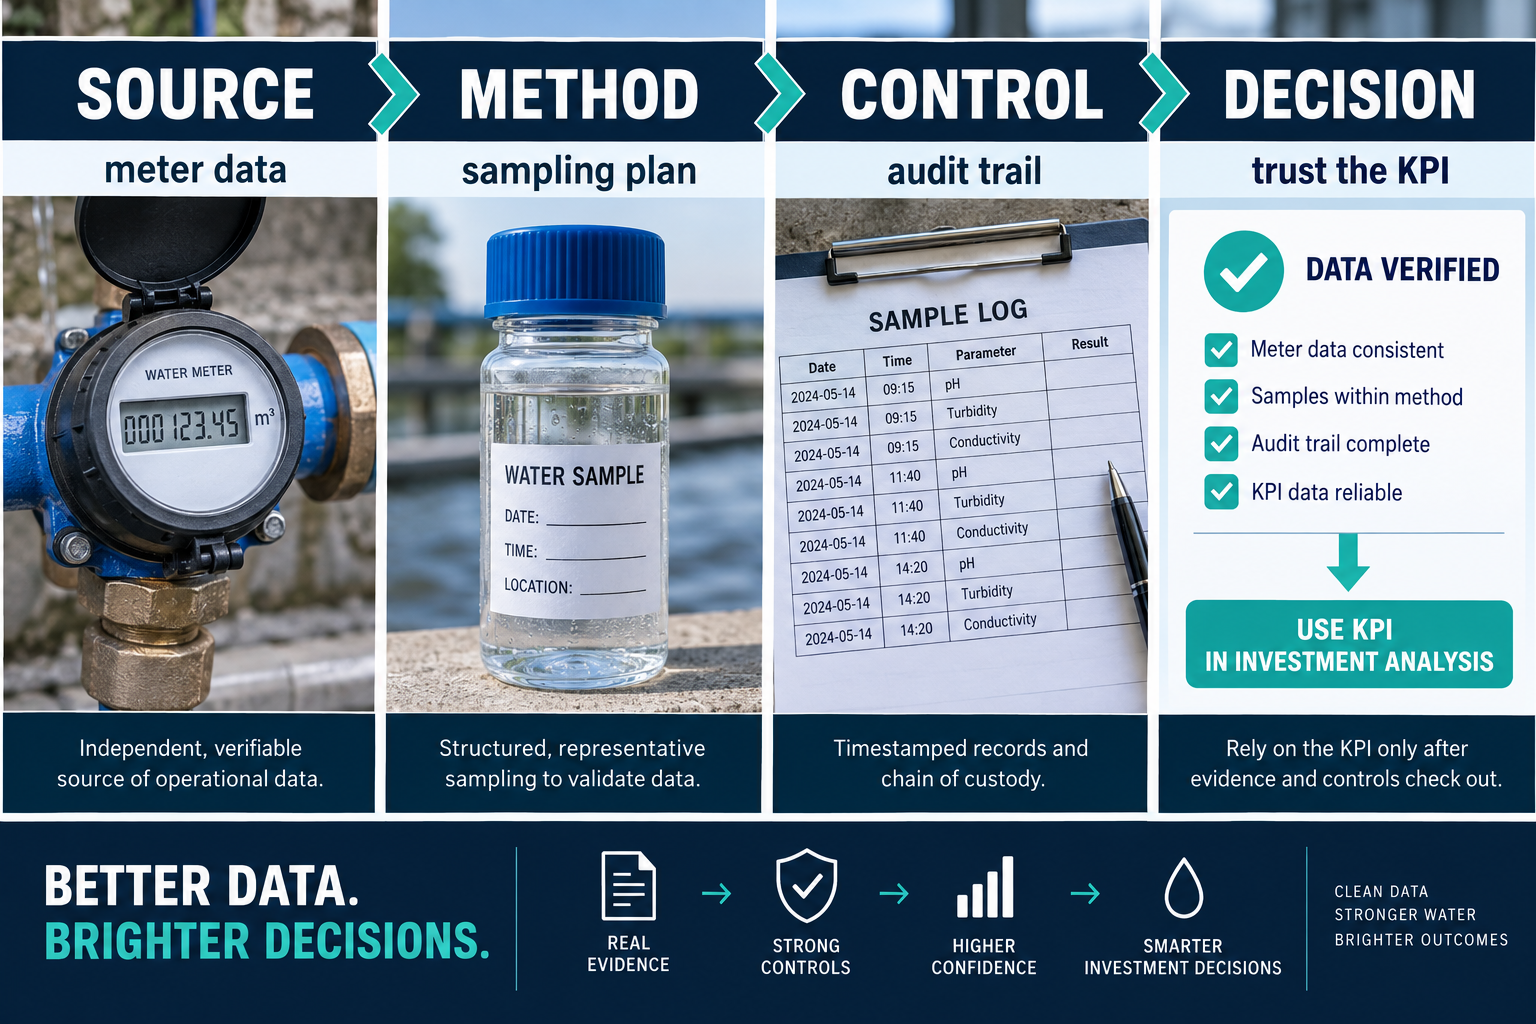
Before accepting a KPI, ask:
- Who owns the data and who can change it?
- What asset, site, customer or time period does it cover?
- How is the instrument calibrated or the sample tested?
- What happens when data is missing, estimated or outside the normal range?
- Can the number be reconciled to an operational or financial record?
- Has an independent party reviewed the method or result?
The Impact Principles’ discussion of monitoring highlights the value of regular data collection, comparison with expectations and responses to underperformance. It also notes a tension between standardised indicators and investment-specific measures. A practical solution is a hybrid: a common core for portfolio reporting, plus bespoke measures for the technology and water context.
Data quality has a commercial consequence. Poor calibration can create customer disputes. Weak sampling can hide treatment failure. Inconsistent site definitions can distort margin analysis and portfolio aggregation. The KPI control should therefore sit with the operating and finance teams, not only the impact-reporting function.
Set targets, cadence and decision thresholds
A KPI becomes useful when it changes behaviour. Set a baseline, a target, a reporting cadence and a response before the next reporting period begins. The response may be operational support, a revised plan, a reserve, a covenant, a paused deployment or a change in the investment thesis.
Targets should match the company’s stage. A pilot business may track evidence of repeatability, customer validation and measurement readiness. A growth-stage company may need cohort retention, deployment margin, service reliability and outcome performance across multiple sites. A mature operator may need portfolio aggregation, third-party assurance and exit continuity.
Use leading and lagging indicators together. A leading indicator might be the share of sites with calibrated sensors or completed maintenance. A lagging indicator might be verified water reuse or a sustained quality result. Leading indicators help an investor act before the outcome deteriorates. Lagging indicators show whether the intended change occurred.
Set thresholds that are material to the business. A small variance may be normal in a pilot but unacceptable under a customer contract. A rising treatment volume may be positive until energy intensity erodes margins. A dashboard should make these trade-offs visible.
For portfolio reporting, keep a short monthly or quarterly operating pack and a deeper annual impact review. The frequency should reflect the risk and the speed of change. More frequent reporting is not automatically better if the data is rushed or unreliable.
Avoid common KPI failures
The first failure is counting activity as impact. Equipment installed, sites visited or samples tested can be useful outputs. They do not prove a lasting outcome.
The second is reporting a total without a denominator. “Water saved” needs a defined site, period, baseline and method. Otherwise, the number may not be comparable or decision-useful.
The third is using a framework name as a substitute for evidence. Alignment with IRIS+, the SDGs, the Impact Principles or a taxonomy criterion does not remove the need for company-level data. Frameworks help structure the questions. They do not answer them for the investee.
The fourth is ignoring negative impact. Treatment can require energy, create residual streams or shift risk to another part of the system. Monitoring technology can raise privacy, security or governance questions. The KPI set should include a way to spot harm, not only a way to report benefit.
The fifth is creating too many KPIs. A long list can hide the few measures that drive the investment case. A focused set with named owners and clear thresholds is more useful than a large dashboard that nobody challenges.
The final failure is separating impact reporting from commercial diligence. The board, finance team, operations team and impact lead should understand the same definitions. Investors should test the KPI in the data room, in management reporting and in customer evidence.
Questions investors should ask
What are impact investing KPIs?
Impact investing KPIs are defined measures that track whether an investment is producing its intended social or environmental outcomes, at what scale, for whom and with what risks. In water, they should sit alongside commercial and operating measures.
Which KPIs matter most for water investments?
It depends on the business model and outcome. Common areas include treated or reused water, pollutant reduction, water-use efficiency, service reliability, customer retention, unit economics, data quality and negative-impact controls.
How can investors avoid impact washing with KPIs?
Link every KPI to an explicit objective, baseline, calculation method, data owner, reporting cadence and decision threshold. Independent checks and stakeholder evidence can strengthen the process.
Should impact KPIs be standardised across a water portfolio?
A hybrid approach is usually more useful. A small common set supports portfolio comparison. Company-specific indicators capture the relevant technology, customer setting, water stress and outcome pathway.
Do impact investing KPIs prove investment returns?
No. Impact KPIs describe outcomes and the quality of the impact-management process. They do not guarantee financial performance, replace commercial due diligence or remove the risks of private-market investing.
A disciplined next step for water investors
Impact investing KPIs are strongest when they make the investment thesis testable. The goal is not to produce a perfect dashboard. It is to connect customer demand, operating evidence, water outcomes, investor contribution and downside risk in a chain that can be challenged.
Investors reviewing direct opportunities can start with five documents: the impact thesis, the KPI definitions, the baseline, the data-control plan and the latest management report. Compare them with contracts, site evidence and financial results. The Water Investment Network portfolio is the place to review the type of direct opportunity the framework is designed to assess. Any gap should become a diligence question before it becomes a portfolio problem.
Water Investment Network connects eligible investors with selected direct private-company opportunities in water technology. It does not provide regulated financial advice or guarantee returns. To discuss access to the network, visit the investor application page or use the contact page.
Sources
- Operating Principles for Impact Management: The 9 Principles
- Impact Principles: Principle 6, Impact Monitoring
- GIIN IRIS+: An Introduction to Impact Measurement and Management
- GIIN IRIS+ Catalog of Metrics
- United Nations SDG Indicators: Goal 6 metadata repository
- European Commission: Taxonomy Regulation and Environmental Delegated Act