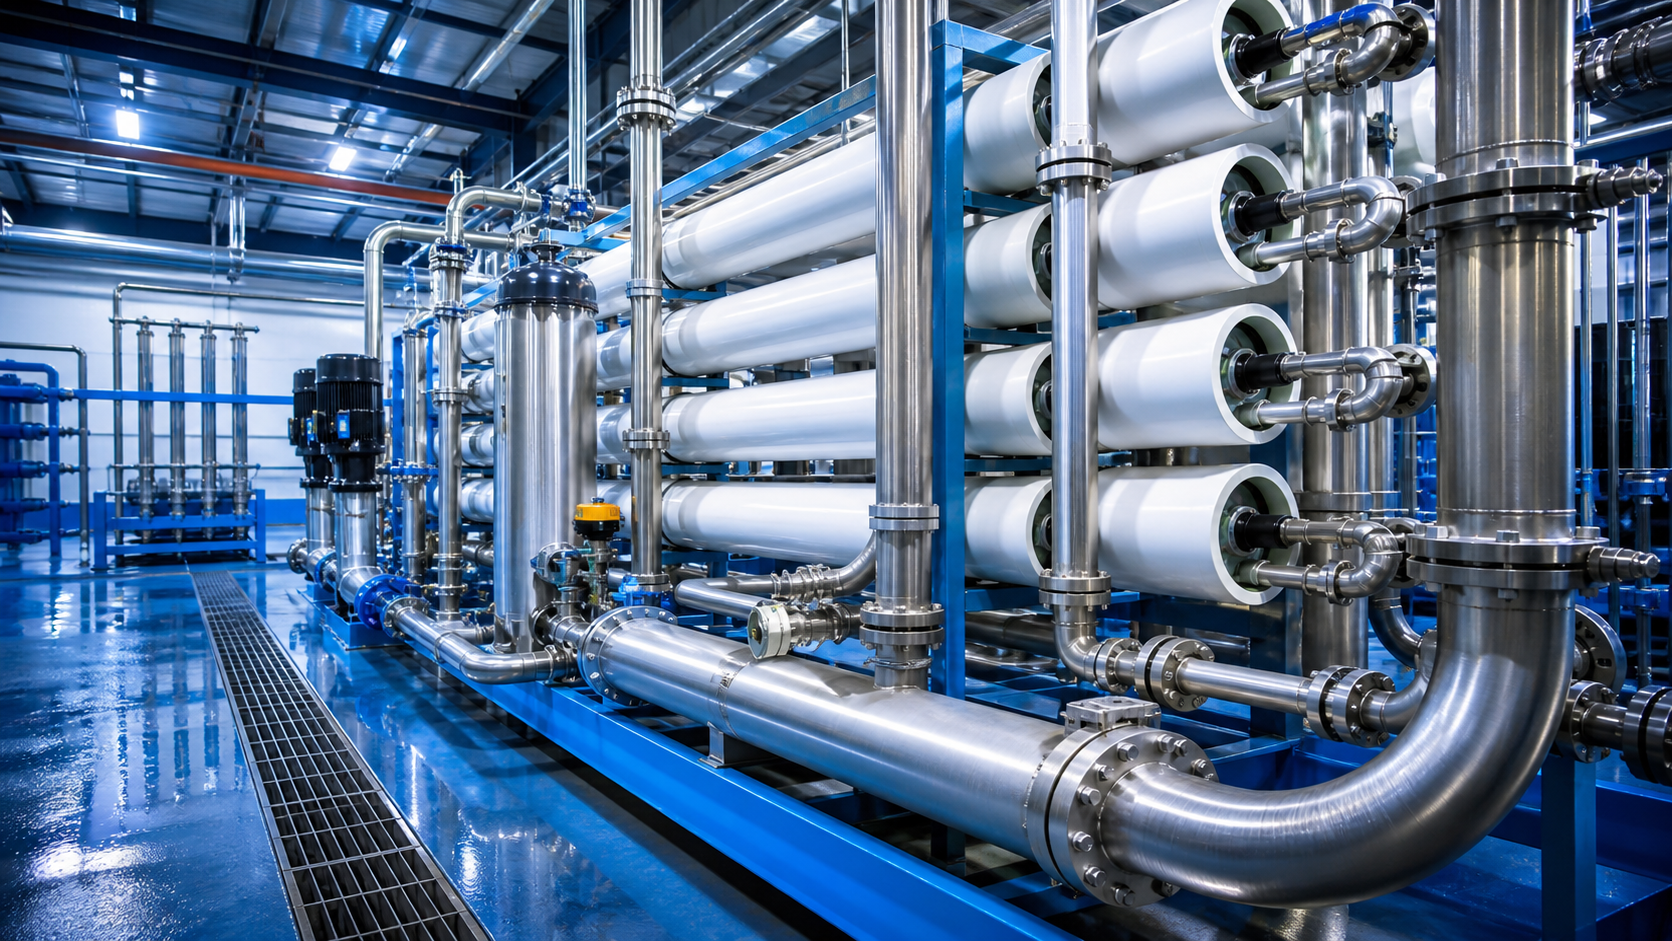
Reverse osmosis and nanofiltration solve valuable water-separation problems. They can recover usable water, remove dissolved contaminants, produce high-purity process water and reduce dependence on conventional supply. They can also consume significant energy, foul under real feed conditions and create a concentrate that remains costly to manage.
That combination makes membranes a strong diligence topic. The investment case is not that water passes through a clever barrier. It is that a company can deliver a required quality and recovery at a competitive lifetime cost, repeatedly, for customers with a reason to buy.
Water Investment Network’s portfolio describes a company developing high-recovery reverse-osmosis and nanofiltration systems for wastewater clean-up, reuse, brine minimisation and high-purity water. This article does not assess or recommend that company. It uses the sector to explain the evidence a private investor should demand.
The guide covers membrane fundamentals in plain English, customer economics, energy, fouling, concentrate, revenue models, scale, impact and potential exit logic.
It is for eligible family offices, high-net-worth individuals and sophisticated investors examining direct private companies. These investments are concentrated and illiquid, can require follow-on capital and may lose value. Water Investment Network does not provide regulated financial advice or guarantee an exit or return. Each opportunity requires independent legal, tax, financial, commercial and technical diligence.
Understand the separation job before the membrane
A membrane is a selective barrier. Pressure or another driving force moves part of a water stream across it while salts, organics or other constituents are retained to different degrees. The output is a treated stream and a concentrated stream.
Reverse osmosis uses pressure to overcome natural osmotic movement and separate water from dissolved salts. It is widely used for desalination, high-purity water and reuse. Nanofiltration is generally less restrictive and can remove multivalent ions and larger dissolved molecules while allowing some monovalent salts to pass. Exact performance depends on membrane chemistry, pressure and feed conditions.
The US Department of Energy explains that reverse osmosis uses high-pressure pumps to move water through a semi-permeable membrane and leaves a concentrated brine. It also notes that salinity increases the pressure requirement and can create operating limits. [1]
Investors should begin with the separation job:
- What is in the incoming water, and how does it vary?
- Which constituents must be removed, retained or recovered?
- What quality does the customer need, and for which use?
- What recovery rate is technically and economically valuable?
- What happens to the concentrate?
- Which pre-treatment and post-treatment steps are required?
A high rejection percentage can be impressive but commercially incomplete. The customer buys fit-for-purpose water, reliable throughput and manageable residuals. Compare the full treatment train, not a membrane coupon tested alone.
The product boundary also matters. A membrane material company, module manufacturer, system integrator and service operator have different intellectual property, margins, working capital and liability. Identify which part the investee owns.
Translate recovery, rejection and flux into economics
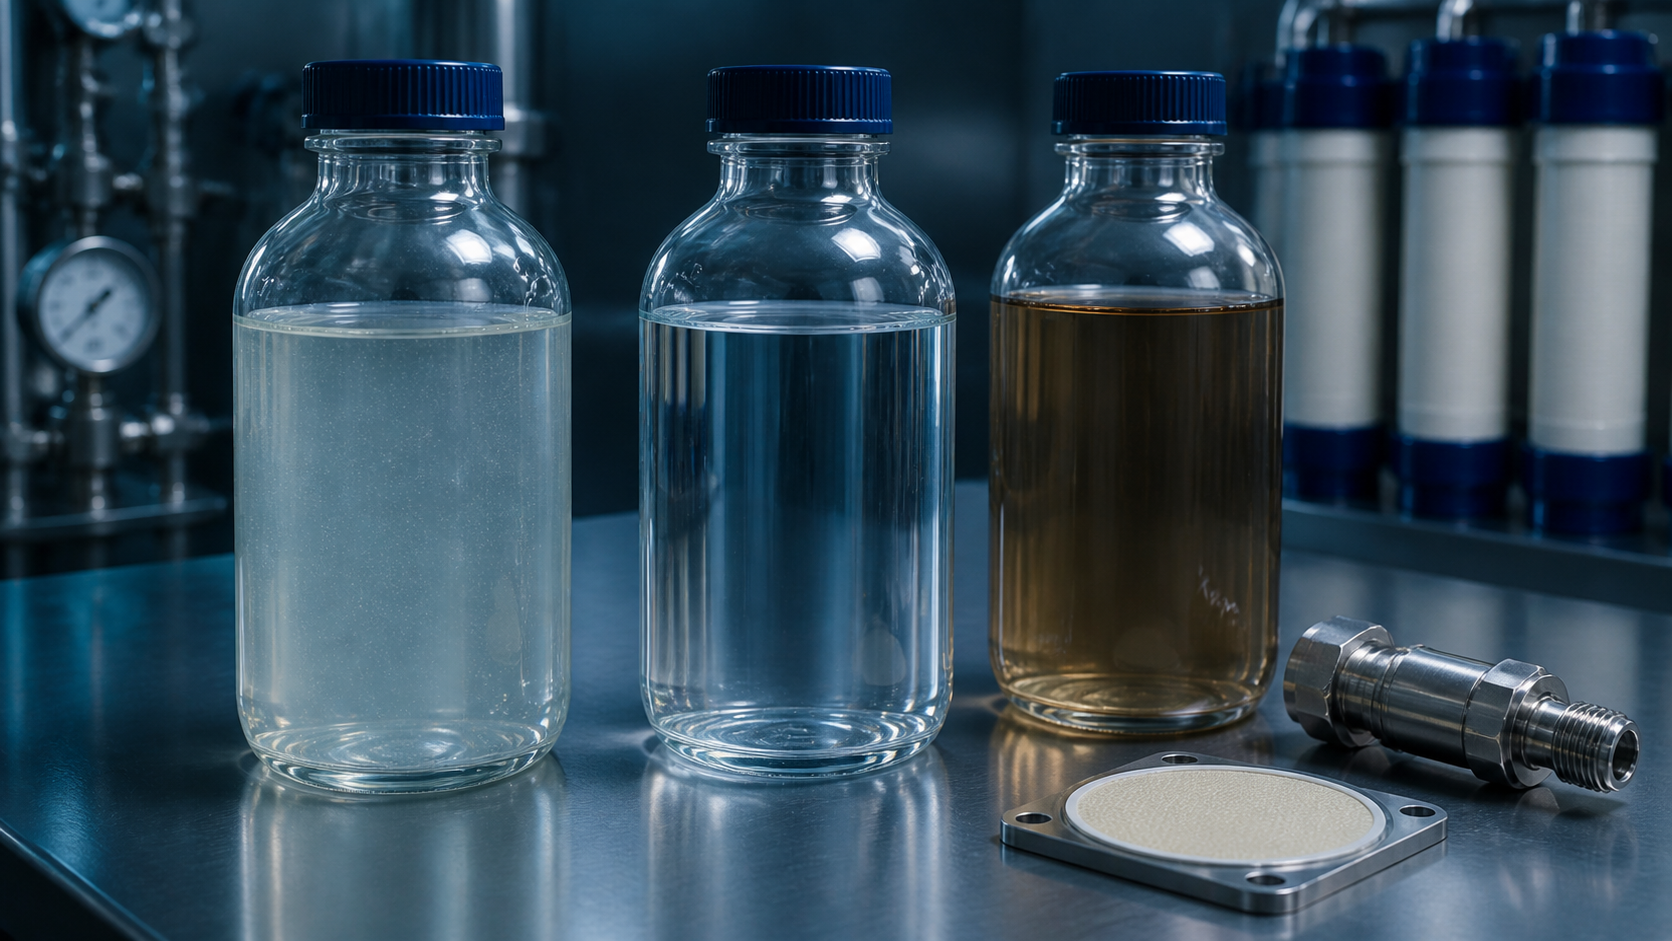
Three technical measures appear frequently in membrane claims. Recovery is the proportion of incoming water converted into the treated stream. Rejection describes how effectively a constituent is kept from passing through. Flux is the flow through a membrane area over time.
Higher is not automatically better. Greater recovery can reduce feedwater and concentrate volume, but it may increase pressure, scaling and cleaning. Higher flux can reduce membrane area while accelerating fouling or shortening useful life. Strong rejection can require more energy or remove constituents that the process could tolerate.
Build economics from the customer specification. Include:
- capital cost for the complete system and integration;
- energy per treated unit at representative conditions;
- pre-treatment, anti-scalants, cleaning chemicals and filters;
- membrane life and replacement cost;
- labour, downtime and monitoring;
- concentrate treatment, disposal or recovery;
- treated-water value and avoided water or discharge cost; and
- the value of reliability, footprint or production capacity.
Use a lifecycle cost per unit of compliant water, not only electricity per cubic metre or membrane price. Compare it with incumbent treatment, outsourcing, freshwater supply and the customer’s option to defer.
Performance guarantees should name the feed envelope, temperature, pressure, quality, recovery, availability and test method. If the warranty excludes the conditions most common in the target market, the commercial proposition may be weaker than the headline data.
Review sensitivity. Change salinity, temperature, fouling rate, energy price, membrane life and concentrate cost. Identify which variable controls payback and who carries it under the contract.
Treat energy and concentrate as core investment variables
Energy is not a footnote in membrane treatment. Pressure, feed quality, recovery, pumping efficiency and energy recovery determine operating cost and environmental performance.
The International Energy Agency’s Water-Energy Nexus analysis found that water-sector energy demand was expected to rise substantially through 2040, with desalination a major contributor. It also highlighted regional differences, including the importance of desalination in the Middle East. [2]
The forecast is not a current market-size claim for one company. It establishes why energy intensity remains commercially material. A membrane supplier should show measured energy under realistic operating conditions and explain how pumps, controls, staging and energy-recovery devices contribute.
Concentrate or brine is the other half of the mass balance. Higher recovery reduces its volume but usually increases concentration. Disposal options depend on location, chemistry, regulation and infrastructure. Deep-well injection, sewer discharge, evaporation, crystallisation, further separation and beneficial recovery each carry limits and cost.
Ask four questions:
- What exactly remains in the concentrate?
- What legal and physical route takes it away from the process?
- What does that route cost at target scale?
- Who is liable if composition or volume changes?
Resource recovery can strengthen economics when a valuable material is present at saleable purity and sufficient volume. Confirm the downstream process, product specification, offtake, price assumptions and residual waste. Theoretical mineral content is not revenue.
Investors should see an energy and mass balance for the complete train. A process cannot claim zero waste by moving contaminants into an unaccounted stream. It cannot claim low energy by excluding pre-treatment or concentrate management that customers must still fund.
Make fouling and membrane life visible in diligence
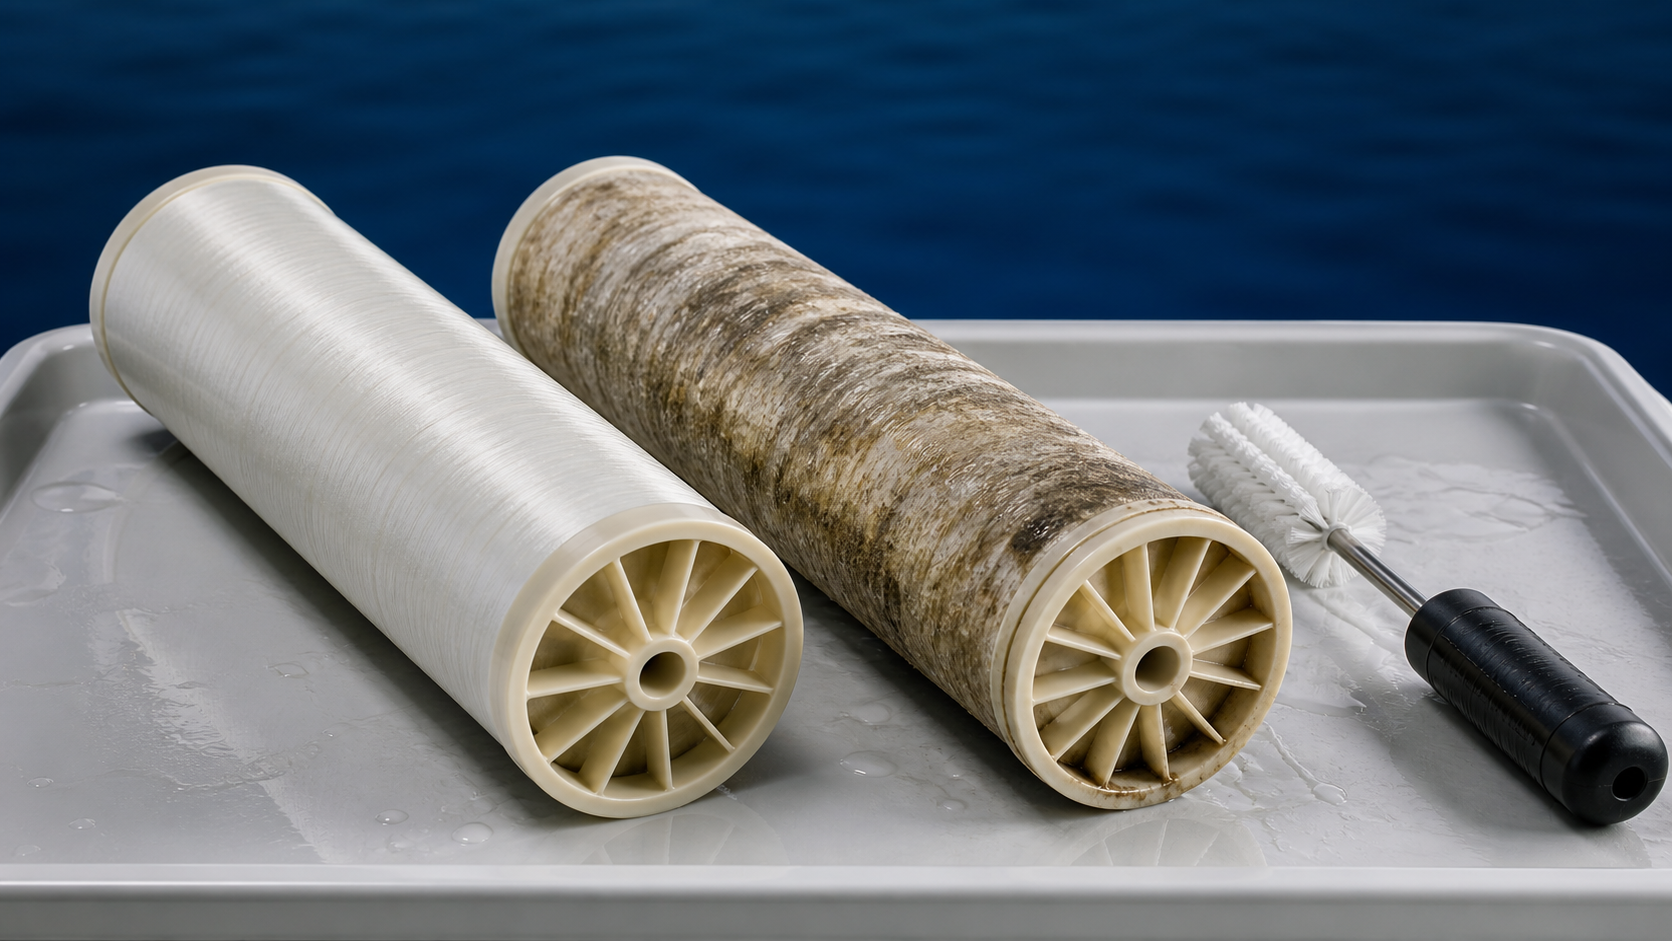
Fouling occurs when material accumulates on or within the membrane, reducing performance or increasing pressure. Scaling deposits sparingly soluble salts. Organic matter, biological growth, suspended solids and process chemicals can create other forms of impairment.
Fouling is not a single defect that good technology eliminates. It is an operating condition to predict, limit, detect and manage. The investment question is whether the company delivers stable economics across the feed conditions it intends to serve.
Request time-series data showing pressure, flux, quality, recovery, cleaning and downtime. A short before-and-after chart can hide frequent interruptions or declining performance. Examine several cleaning cycles and the conditions that triggered them.
Membrane-life claims should be supported by operating cohorts. Separate:
- modules still installed from modules still meeting specification;
- normal replacement from failure;
- life under representative feeds from benign demonstrations;
- customer-operated sites from supplier-operated sites; and
- planned cleaning from unexpected intervention.
Pre-treatment can protect the membrane while adding equipment, consumables and space. Review whether the company’s claimed advantage remains after all required upstream steps are included.
Monitoring and control may create defensibility. Data can enable predictive cleaning, optimise recovery and reduce operator burden. Investors should check whether algorithms work across customers, whether the company owns the data rights and whether recommendations lead to measurable operating improvements.
Service records reveal product maturity. A well-run business categorises failures, performs root-cause analysis, updates design and budgets warranty honestly. A company that attributes every issue to customer misuse may not understand its commercial operating environment.
Compare membrane-company revenue models
Membrane businesses can earn revenue from materials, modules, complete systems, consumables, service, software or treated-water outcomes. The model determines margin and scale.
| Business model | Value driver | Diligence focus |
|---|---|---|
| Membrane material or coating | Performance and licensing potential | Manufacturability, quality, freedom to operate and customer qualification |
| Module manufacturing | Standard product and installed base | Yield, supplier control, replacement cycle and price competition |
| System integration | Complete customer outcome | Project margin, bespoke engineering, warranty and working capital |
| Service and replacement | Recurring installed-base revenue | Retention, logistics, technician capacity and substitution |
| Monitoring and optimisation | Data-led performance and subscription | Integration, demonstrable savings, renewal and cyber security |
| Treatment as a service | Long contracts and outcome pricing | Asset finance, customer credit, availability and residual value |
A materials innovation may offer strong intellectual property while facing a long qualification path with module makers and end customers. A system integrator can reach revenue earlier while relying on third-party membranes and project execution.
Replacement revenue can be attractive, but customers may multi-source or extend membrane life. Examine contractual rights, physical compatibility, price, technical support and installed-base usage.
Treatment-as-a-service can reduce customer capital friction. It also requires financing and exposes the supplier to feed, energy and performance risk over many years. Separate the technology-company valuation from the capital structure used to own customer assets.
Recurring software should be measured by active deployments, renewal, gross retention and proven customer action. A dashboard attached to an equipment sale is not automatically a software business.
Build the membrane investment thesis at a glance
| Element | Evidence to seek | Principal risk |
|---|---|---|
| Demand | Required quality, recovery, footprint or operating-cost improvement | Technology is interesting but not budget-critical |
| Customer | Specific industrial, reuse or desalination application | Unbounded application claims and scattered sales |
| Performance | Long-duration field data over realistic feed variation | Lab result does not survive fouling and operations |
| Economics | Complete lifecycle cost including concentrate | Headline energy or recovery excludes material inputs |
| Revenue | Clear module, system, service or outcome contracts | Pilots, grants and pipeline presented as repeatability |
| Scale | Manufacturing yield, standard design and service plan | Founder-led engineering remains the delivery system |
| Exit | Strategic need for technology, installed base or customer access | Value relies on a generic water-market multiple |
| Impact | Verified usable water, energy, recovery and residual boundary | Water volume claimed without quality or destination |
The thesis should state the target application and why the company wins there. “A better membrane” is not enough. The advantage may be higher recovery on a difficult feed, lower pressure at a required quality, longer life, easier cleaning, a smaller footprint or system integration that reduces customer risk.
Quantify the advantage against the customer’s incumbent. Use independent or customer data where possible. Confirm which benefits remain at commercial scale and after the full treatment train is included.
Growth capital should fund a defined de-risking path: manufacturing capacity, qualification, reference deployments, channel access, service capability or working capital. Each use of funds should link to a valuation-relevant milestone.
Evaluate end markets, regulation and adoption timing
Membranes serve desalination, industrial process water, wastewater reuse, high-purity production and contaminant removal. These end markets differ in buyer, scale, risk and procurement.
Water reuse is a growing policy focus. The European Commission describes wastewater as a predictable alternative supply and notes that the EU Water Reuse Regulation sets minimum quality, monitoring, risk-management and permitting requirements for agricultural irrigation. [3]
That rule does not govern every industrial reuse project, but it demonstrates how quality, monitoring and risk management shape adoption. Investors should identify the exact requirements for each intended use and jurisdiction.
Industrial customers may move faster than public utilities when an operating problem has a clear payback and a site owner controls procurement. They can also demand strict reliability, integration and confidentiality. Utility and municipal markets can offer large projects but require framework access, long validation and public procurement.
Desalination provides a large technical reference market, yet conditions differ between seawater, brackish water and industrial concentrate. Do not transfer performance or cost assumptions without checking salinity, temperature, intake, pre-treatment and disposal.
Regional analysis should distinguish the UK, EU and individual GCC countries. Energy price, water price, public ownership, permitting, localisation and environmental conditions affect the value proposition. A Gulf desalination reference may not validate an industrial-reuse sale in Britain, and the reverse is also true.
Build an adoption timeline from evidence: lab validation, module testing, customer pilot, commercial demonstration, approved-vendor status, first repeat order and wider rollout. Note the capital and calendar needed for each stage.
Verify manufacturing, intellectual property and scale
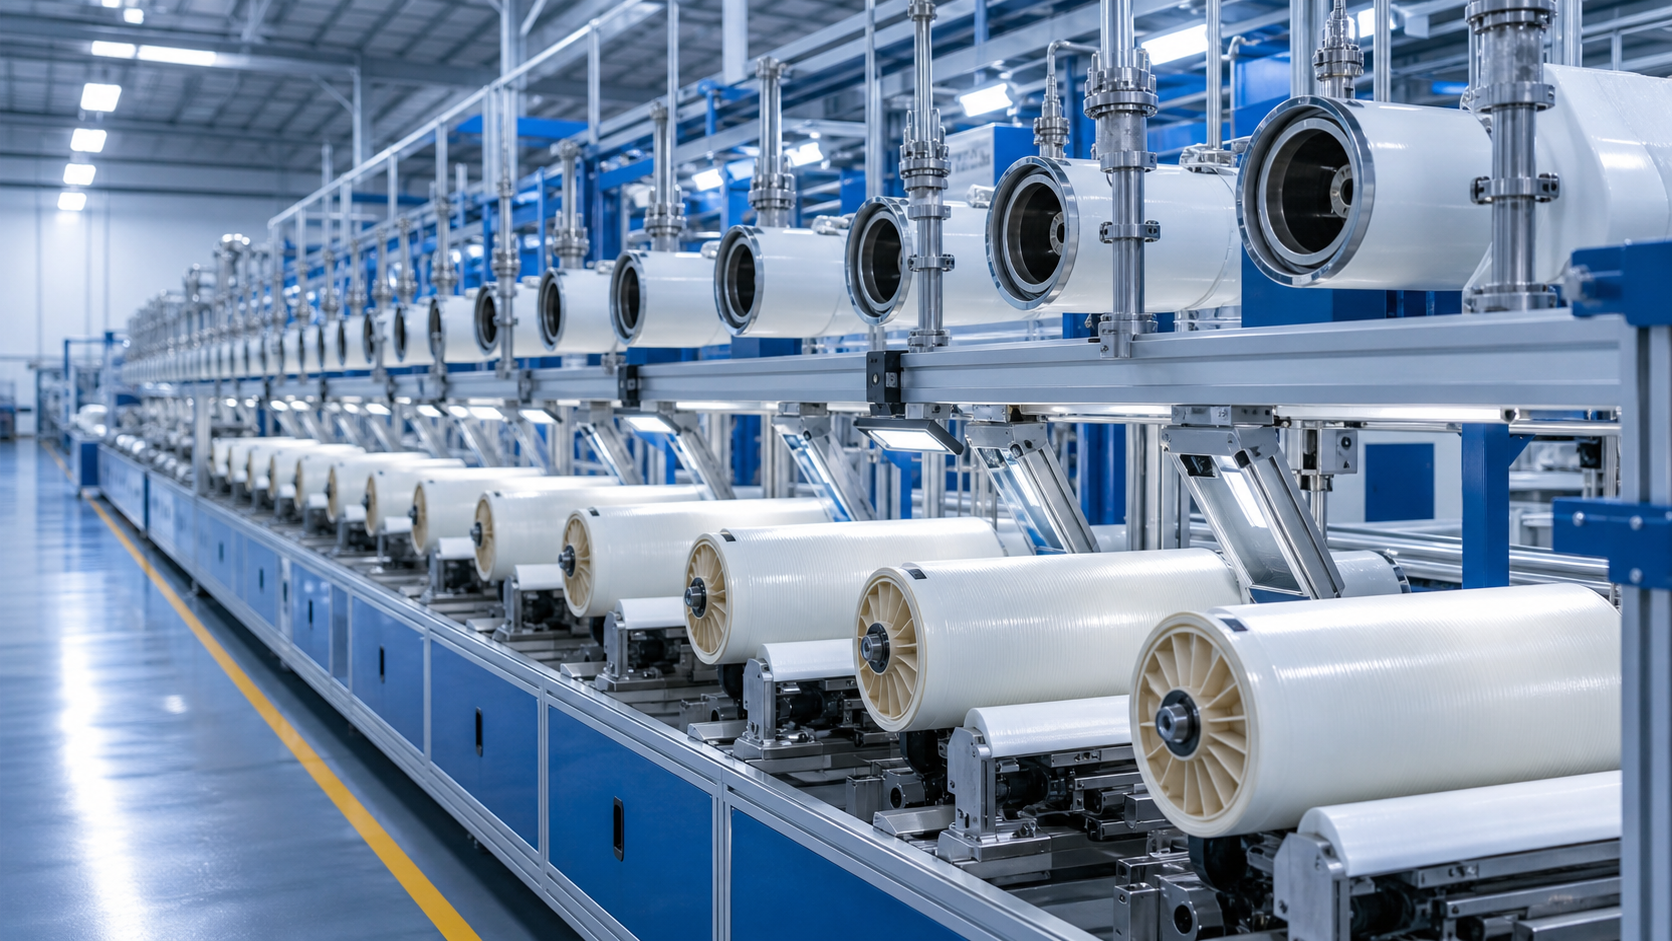
A membrane company can possess strong laboratory performance and still fail during manufacture. Uniformity, defect rate, coating control, material sourcing, module assembly and quality assurance determine whether performance survives volume.
Review production yield by batch and the tests that release a product. Trace failures to raw material, process variation, storage, assembly or field handling. Confirm the capital equipment and skilled labour required for the next stage of output.
Intellectual-property diligence should cover ownership, inventorship, licences, jurisdictions, claims, remaining life and freedom to operate. The value of a patent depends on how easily competitors can design around it and whether infringement can be detected.
Know-how may be equally important. Recipes, process windows, quality data and module design can be difficult to recreate. Protecting them requires access control, documentation and employment or supplier agreements.
Scale also depends on supply. Identify critical polymers, substrates, spacers, pressure vessels, pumps and electronics. Review single-source components, lead times, alternative qualification and price exposure.
System companies need a bounded product architecture. Count engineering hours and unique components by deployment. Measure commissioning time, site changes, service calls and gross margin across cohorts.
Channel partners can expand reach, but only if they understand the feed conditions, design boundaries and service obligation. Audit training, opportunity ownership, pricing, warranty and end-customer access. A signed distributor agreement without projects is not a route to market.
Measure impact and downside risk together
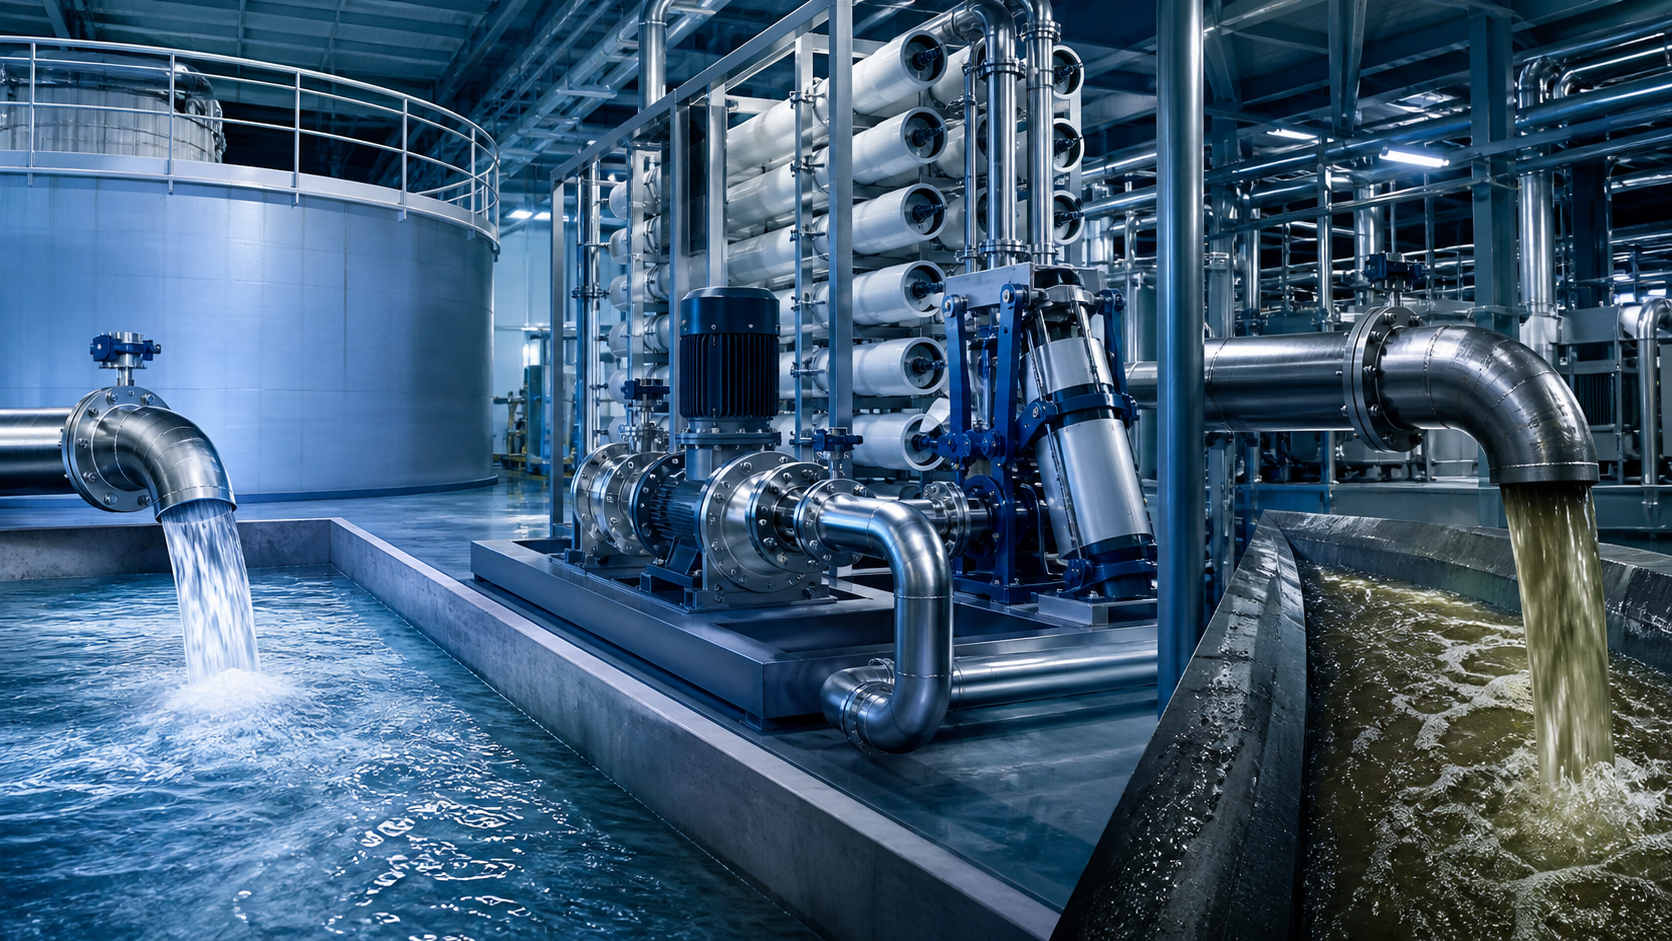
Membrane impact is not simply litres processed. Measure the usable outcome and the resource inputs required to create it.
A practical set includes:
- treated volume and quality at the defined use point;
- recovery and concentrate volume;
- freshwater or alternative treatment avoided;
- energy per unit at representative conditions;
- chemicals, filters and membrane replacement;
- system availability and useful membrane life; and
- concentrate destination and recovered material, if any.
Use a baseline that matches production and water quality. If the customer changes output or feed source, normalise the comparison. Avoid adding treated volume across sites when quality, use and system boundaries differ without explaining the aggregation.
Downside cases should include faster fouling, shorter membrane life, higher energy, lower recovery, more pre-treatment, delayed qualification and concentrate cost. Combine technical and financial effects in one model.
Impact claims should be supported by operating data and customer confirmation. Independent testing can validate performance, but long-term commercial operation remains essential.
Potential exits may involve membrane manufacturers, equipment groups, industrial service providers or technology platforms. The buyer rationale might be protected performance, manufacturing capability, an installed base, customer access or integration into a broader treatment offering. None is assured.
Manufacturing diligence should begin with the bill of materials and process flow for each commercial product. Identify which properties are created by raw material, coating, casting, curing, rolling, potting, housing and final test. Link each critical step to a measurable specification and release record. A patent can protect a formulation while process control determines whether customers receive it consistently.
Trace several production lots from incoming material to customer shipment. Review certificates, in-process measurements, rejected units, rework, final integrity tests and retained samples. Compare laboratory performance with the same lot’s field result where possible. If the company cannot link a deployed module to its materials and test history, diagnosing failure and defending quality claims will be difficult.
Study variation, not only averages. Request distributions for permeability, rejection, defect rate, pressure loss and other application-specific measures. Check whether specifications widened as volume increased or whether rejected material was diverted into a lower-grade product without clear control. A small improvement in yield may support margin, while hidden rework can consume labour and capacity.
Assess supplier risk at the chemical, substrate, spacer, adhesive, pressure-vessel and specialist-equipment level. Record sole sources, minimum orders, lead times, storage limits, change-notification rights and qualified alternatives. Substitution can change performance or regulatory status even when the component appears generic. Inventory strategy should reflect qualification time and cash, not simply unit cost.
Intellectual-property review should connect legal protection to the commercial advantage. Confirm ownership and assignments from founders, employees, universities and contractors. Map patents, trade secrets, recipes, software, test data and manufacturing know-how to the customer result. Then ask what a capable competitor could learn from a purchased module and which performance depends on knowledge that remains controlled.
Freedom-to-operate work should match the product, target markets and actual manufacturing route. A positive patent landscape is not a guarantee, and an issued patent is not proof of a broad competitive barrier. Investors should understand expiry, geographic coverage, maintenance, opposition and the cost of enforcement. The value lies in protecting an economically important difference.
Capacity planning should convert forecast modules into coating width, line speed, cure time, assembly labour, test stations, pressure housings, quality staff and working capital. Include changeovers, planned maintenance, yield loss and customer-specific configurations. Compare the model with observed production weeks. A theoretical nameplate rate is not available commercial capacity.
Quality governance needs clear authority. Confirm who can stop a line, release a deviation, approve rework and notify customers. Review complaints, returns, warranty reserves and corrective actions by lot and application. A field failure can arise from membrane manufacture, system design, pre-treatment, operation or cleaning; the company must investigate without shifting every problem to the customer.
Model make-versus-buy decisions through risk and learning as well as margin. Outsourcing can reduce initial capital and access mature processes, but it may dilute feedback, constrain iteration or expose know-how. Internal manufacture can improve control while adding fixed cost, safety duties and scale-up risk. The chosen boundary should fit the proof already achieved and the capital available.
The investment recommendation should identify the next manufacturing milestone and its evidence. It might be a validated commercial line, improved yield across consecutive lots, a qualified second source, a stable warranty cohort or transfer to a contract manufacturer. Tie use of funds and valuation to that milestone rather than assuming laboratory performance automatically becomes industrial output.
Connect manufacturing evidence to customer cohorts. A membrane may behave differently across salinity, temperature, pH, organics, pressure and cleaning regimes. Group warranty and performance records by lot, application and operating envelope. This helps distinguish a production defect from an unsuitable application and shows whether the company’s qualification rules improve with experience.
Commercial contracts should define the boundary between membrane performance and system performance. Review guaranteed rejection, flow, life, storage, commissioning, feed conditions and cleaning obligations alongside limitations and remedies. Check whether sales material promises more than the contract or validated data. A warranty that excludes realistic operating conditions has little customer value; an unlimited promise can create an unpriced liability.
Prepare a capital plan for the next scale state. Separate equipment, facility, validation inventory, working capital, quality systems, hiring and customer qualification. Include the time between buying material and collecting customer cash. Then model a delayed line qualification or lower initial yield. The funding case should allow management to solve a known scale problem without assuming flawless execution.
Agree a concise board scorecard before completion. Track qualified output, first-pass yield, customer acceptance, warranty cohorts, unit cost, inventory, cash conversion and field performance against the validated operating envelope. Pair those measures with pipeline conversion and repeat orders. The scorecard should reveal whether scale is improving product economics or simply moving technical variation into the field.
Keep source records available for independent review.
Validate customer adoption beyond technical trials
Membrane companies can accumulate demonstrations without building a repeatable sales engine. Technical interest is common because customers want to see performance on their own water. Investment value appears when trials convert into standard commercial deployment.
Create a trial ledger with one row per site:
- customer segment and use case;
- feed range and target specification;
- trial duration and operating availability;
- equipment and operating cost paid by each party;
- agreed success criteria and final result;
- decision-maker and procurement stage;
- reason for conversion, delay or rejection; and
- what the company changed as a result.
A paid pilot is stronger than a free test but is not necessarily recurring revenue. Confirm whether the customer bought a learning project, a temporary service or the first stage of a standard rollout.
Customer references should include operations, finance and procurement where possible. The technical champion can describe performance. Operations can explain maintenance and disruption. Finance can confirm the economic case. Procurement can describe the path to approval and repeat purchase.
Track the evidence required for each market. High-purity manufacturing, public water, food production and industrial reuse can demand different validation, certification and liability. Product claims must be scoped to the environments actually tested.
Sales-cycle assumptions should include sampling, design, pilot, capital approval, contracting, manufacturing, installation and acceptance. A twelve-month opportunity can consume engineering support long before revenue is recognised.
Channel partners may accelerate adoption when they already integrate treatment at customer sites. Check whether the partner is able to specify, commission and service the technology, how margin is shared and whether end-customer feedback reaches the company.
Conversion should improve as evidence and product standardisation grow. If every new customer demands a different test with no shortening of cycle or increase in win rate, the route to scale remains unproven.
Assess the leadership and governance required for membrane scale-up
Membrane commercialisation sits across science, manufacturing, systems engineering and customer operations. A balanced leadership team must manage all four without allowing one success measure to dominate.
Technical leadership should state the product envelope and unresolved limits. Manufacturing leadership should own yield, quality and supplier readiness. Commercial leadership should focus sales on applications with demonstrated value. Service leadership should turn field problems into product learning. Finance should connect project obligations to cash and capital.
Ask management to explain a difficult deployment. What assumption failed? How was the customer protected? What did the remedy cost? Which specification, process or contract changed? The answer reveals whether the organisation learns or merely contains problems.
Governance reporting should include:
- field performance and failures by application;
- manufacturing yield and quality escapes;
- commercial trials, conversions and sales cycle;
- project margin, warranty and cash collection;
- membrane replacement and installed-base revenue;
- critical supplier and certification risk;
- impact metrics with energy and residuals; and
- runway under base and downside plans.
Incentives should discourage unsuitable applications and premature claims. Sales targets can include qualified conversion and achieved margin. Technical teams can be measured on commercial reliability as well as laboratory progress.
Growth capital should have stage gates. Manufacturing expansion may follow verified demand and process yield. New regions may follow a repeatable reference and service plan. Owned customer assets may require a financing partner before contracts are signed.
Key-person risk is common in proprietary materials and process recipes. Confirm documentation, access controls, intellectual-property assignment, succession and retention. A buyer will value an organisation capable of reproducing the advantage, not only the inventor who understands it.
Frequently asked questions about membrane investing
What is the commercial difference between reverse osmosis and nanofiltration?
Reverse osmosis generally provides tighter dissolved-solids removal at higher pressure. Nanofiltration can target selected ions and larger dissolved molecules at different pressure and recovery. Customer specifications and lifecycle cost determine the better fit.
Is higher water recovery always better?
No. Higher recovery can reduce feed and concentrate volumes but may increase pressure, scaling, cleaning and residual concentration. Evaluate the full process economics.
What membrane data should investors request?
Request time-series feed, pressure, flux, recovery, quality, energy, cleaning, availability, replacement and concentrate data from representative commercial sites.
Why is concentrate management important?
Membranes separate contaminants rather than destroy them. Concentrate composition, volume, disposal, further treatment and liability can determine project cost and impact.
What makes a membrane company scalable?
Scalability requires repeatable manufacturing, a bounded application envelope, standard system design, qualified supply, predictable commissioning and a service model that grows efficiently.
Explore selected membrane and treatment opportunities
Reverse osmosis and nanofiltration can create valuable water outcomes when separation performance survives real feed conditions and produces a competitive lifetime cost. The investment case belongs in the complete operating system: pre-treatment, energy, cleaning, service and concentrate.
Eligible family offices, high-net-worth individuals and sophisticated investors can request access to Water Investment Network to learn about selected direct private-company opportunities.
Continue with the guides to industrial wastewater treatment investment and smart water monitoring. For general questions, use the contact page.
Water Investment Network does not manufacture membranes, sell equipment, provide engineering services, give regulated financial advice or guarantee returns.